This adds a debug server to `goalc` that sends JSON over the socket to
communicate with an external debugger using the Debug Adapter Protocol.

This lets us debug GOAL code in a proper debugger with breakpoints, step
over, step in and step out per line, stack frames and supports watches
for global symbols, registers and local variables (local variables only
work within the most recent stack frame). Special registers (`r13`,
`r14`, `r15`, argument registers, etc.) are tracked separately and the
current process register even displays the type of the current `pp` if
possible.

Watches that track addresses holding a reference type generate a list of
field names according to the object's type. All fields will show their
name, type and value and, depending on the type, will try to infer extra
info like symbol names/values, function names for `function` fields,
enum values and more. This also works nested, so any field that is also
a reference type can also be accessed and display its fields, etc.
Dynamic arrays are also supported where possible, e.g. in
`inline-array-class` children and boxed arrays, it will figure out the
value of the `length` field and access the memory up to that point so
all the elements can be accessed and viewed from the `data` field.

Our VS Code extension implements the DAP in
open-goal/opengoal-vscode#375.

Using it is as simple as connecting a REPL to a running game instance
with `(lt)`, compiling with `(mi)` and, with the extension installed,
pressing F5 in VS Code to start the debugger. By default, it will try to
connect to the game that the active `.gc` file is from, the socket port
is different per game (8128 for Jak 1, 8129 for Jak 2, 8130 for Jak 3).
The `launch.json` was updated with two entries for this, the second
entry lets you pick the game/port manually if desired.

~~Not tested on Windows.~~ Only supports x86 for now.
Some backtraces are quite large, an option is to increase your terminal
buffer -- but dumping to a file is also useful if you want to share the
crash.
I'm not crazy about the way I hacked this in, but it felt like the least
invasive way for now and I don't want to cause a regression with the
debugger. It's also nice that it dumps with ansi colors as then you can
view the backtrace with the original coloring:
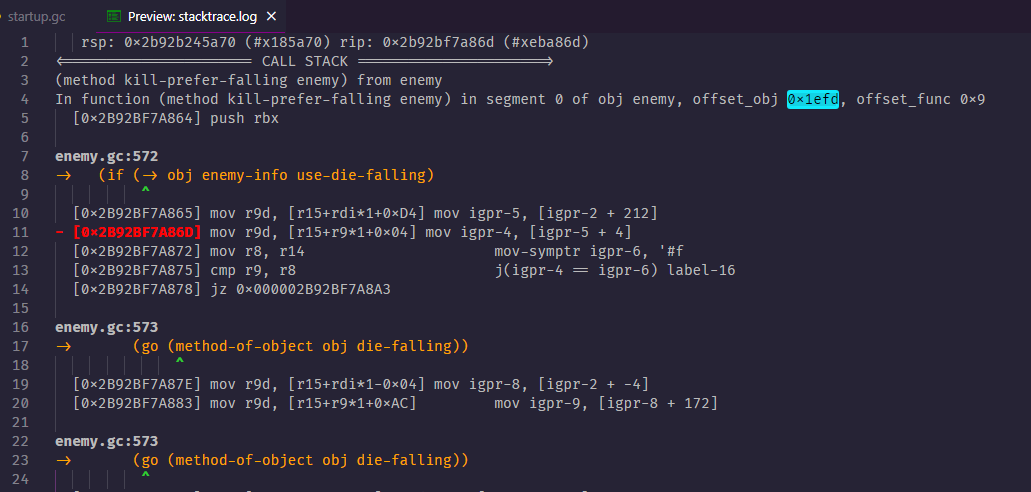
Usage:
```clj
(:di "./stacktrace.log")
```
* improve debugger disasm, `:sym-name` and fix Windows builds

* >:(

* use this inline constexpr thing??

* fine use strings then

* please.... please work...

* fix windows debugger oopsie

* display rip as goal addr as well

* [debugger] attempt to backtrace even if landed on some garbage memory

* Update CMakePresets.json
* time of day

* goal code seems to work

* stars at wrong spot

* stars and sun work

* debugging clouds

* fix texture correction

* sky works

* cleanup, add profiler

* clean up

* final clean up

* offline tests

* missing include
* add some memory utilities

* run waitpid in a separate thread and support very simple breakpoints

* fix breakpoints

* add missing windows stub function

* fix error message on exit
* set up the compiler to ptrace the runtime

* clang format

* move debugger state to a separate Debugger class

* support registers and break and continue

* documentation and fix windows

* make listener part of compiler, not a separate library

* implement memory read and write

* fix for windows
 Hat Kid
